Spending Overview becomes Spending Trend when you open it
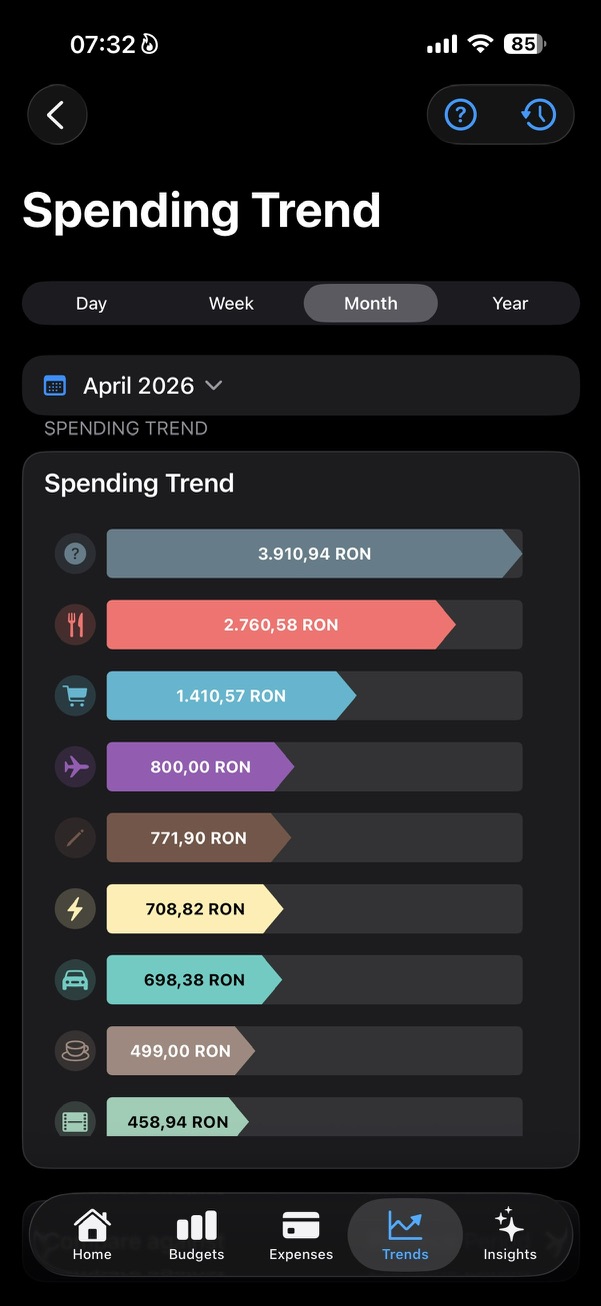
On the main Trends screen, Spending Overview is the quick read. The bars show the categories with the largest amounts for the selected period, so you can see what stands out without opening every transaction.
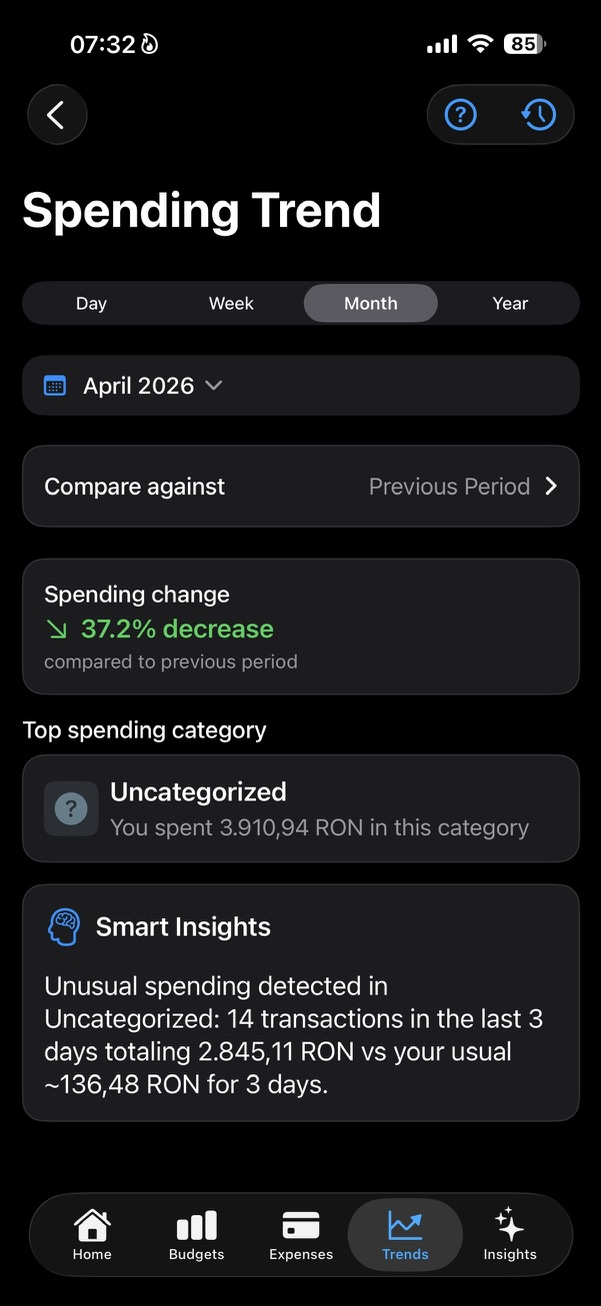
When you open it, the detailed Spending Trend screen goes further. It keeps the chart, then adds Compare against, Spending change, Top spending category, and Smart Insights connected to that trend.
- The chart shows the biggest amounts by category.
- Tapping a bar can reveal quick details for that category.
- The detailed screen explains how the period changed, not only what was spent.
Category Breakdown explains how the total is split
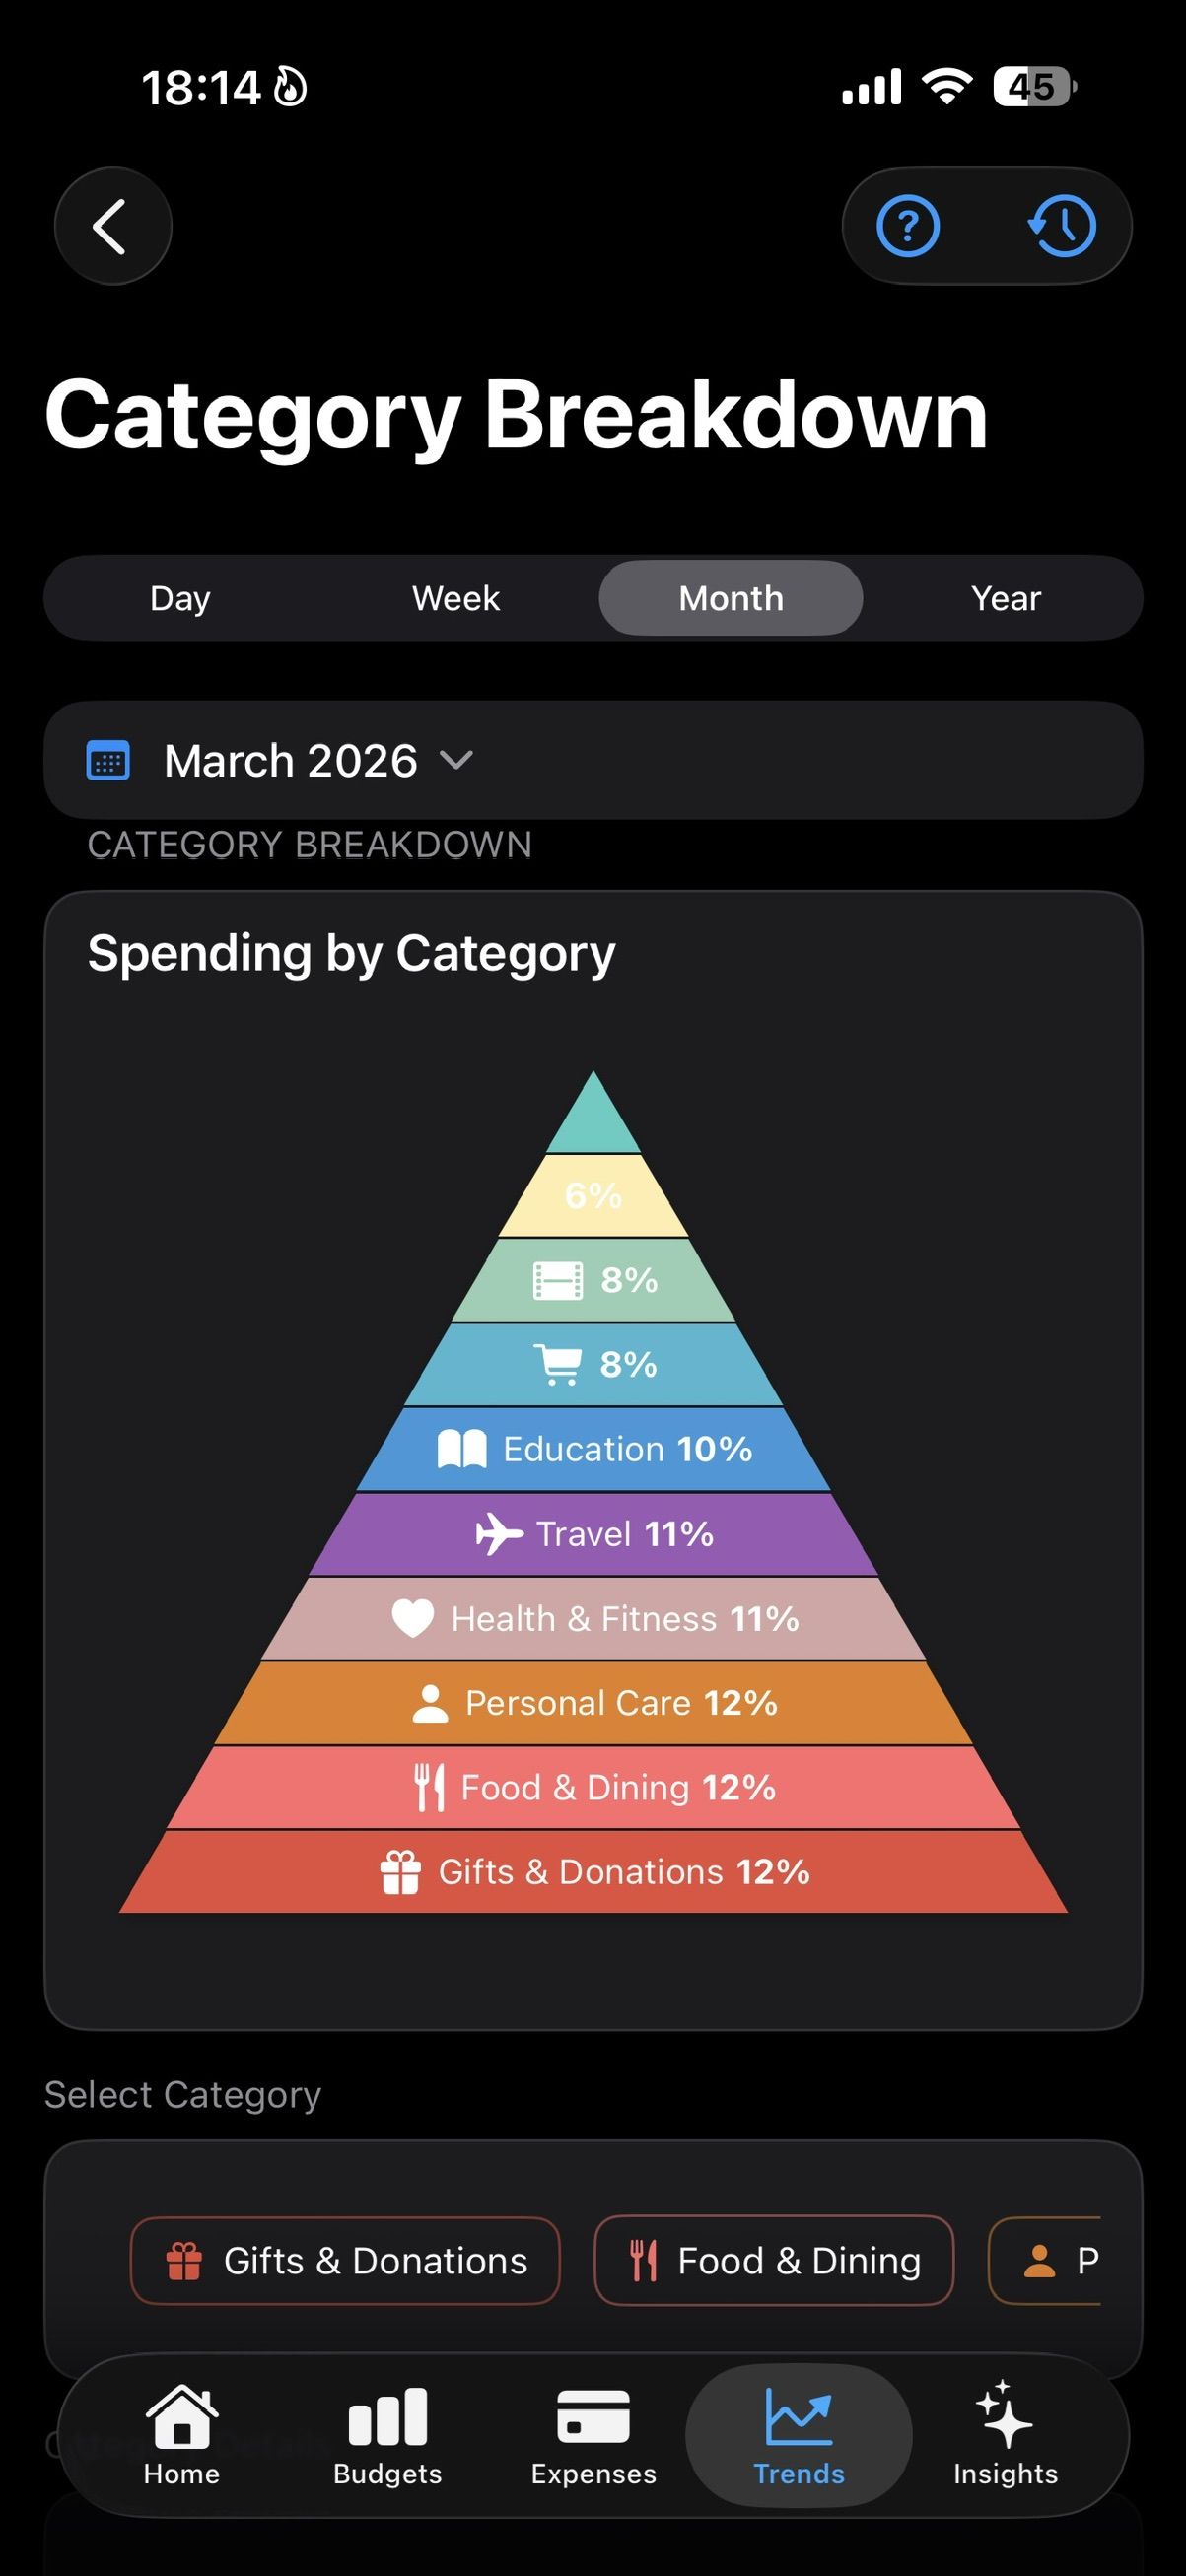
Category Breakdown answers a different question: how much of the selected period belongs to each category. The pyramid makes the shape of the month easy to scan.
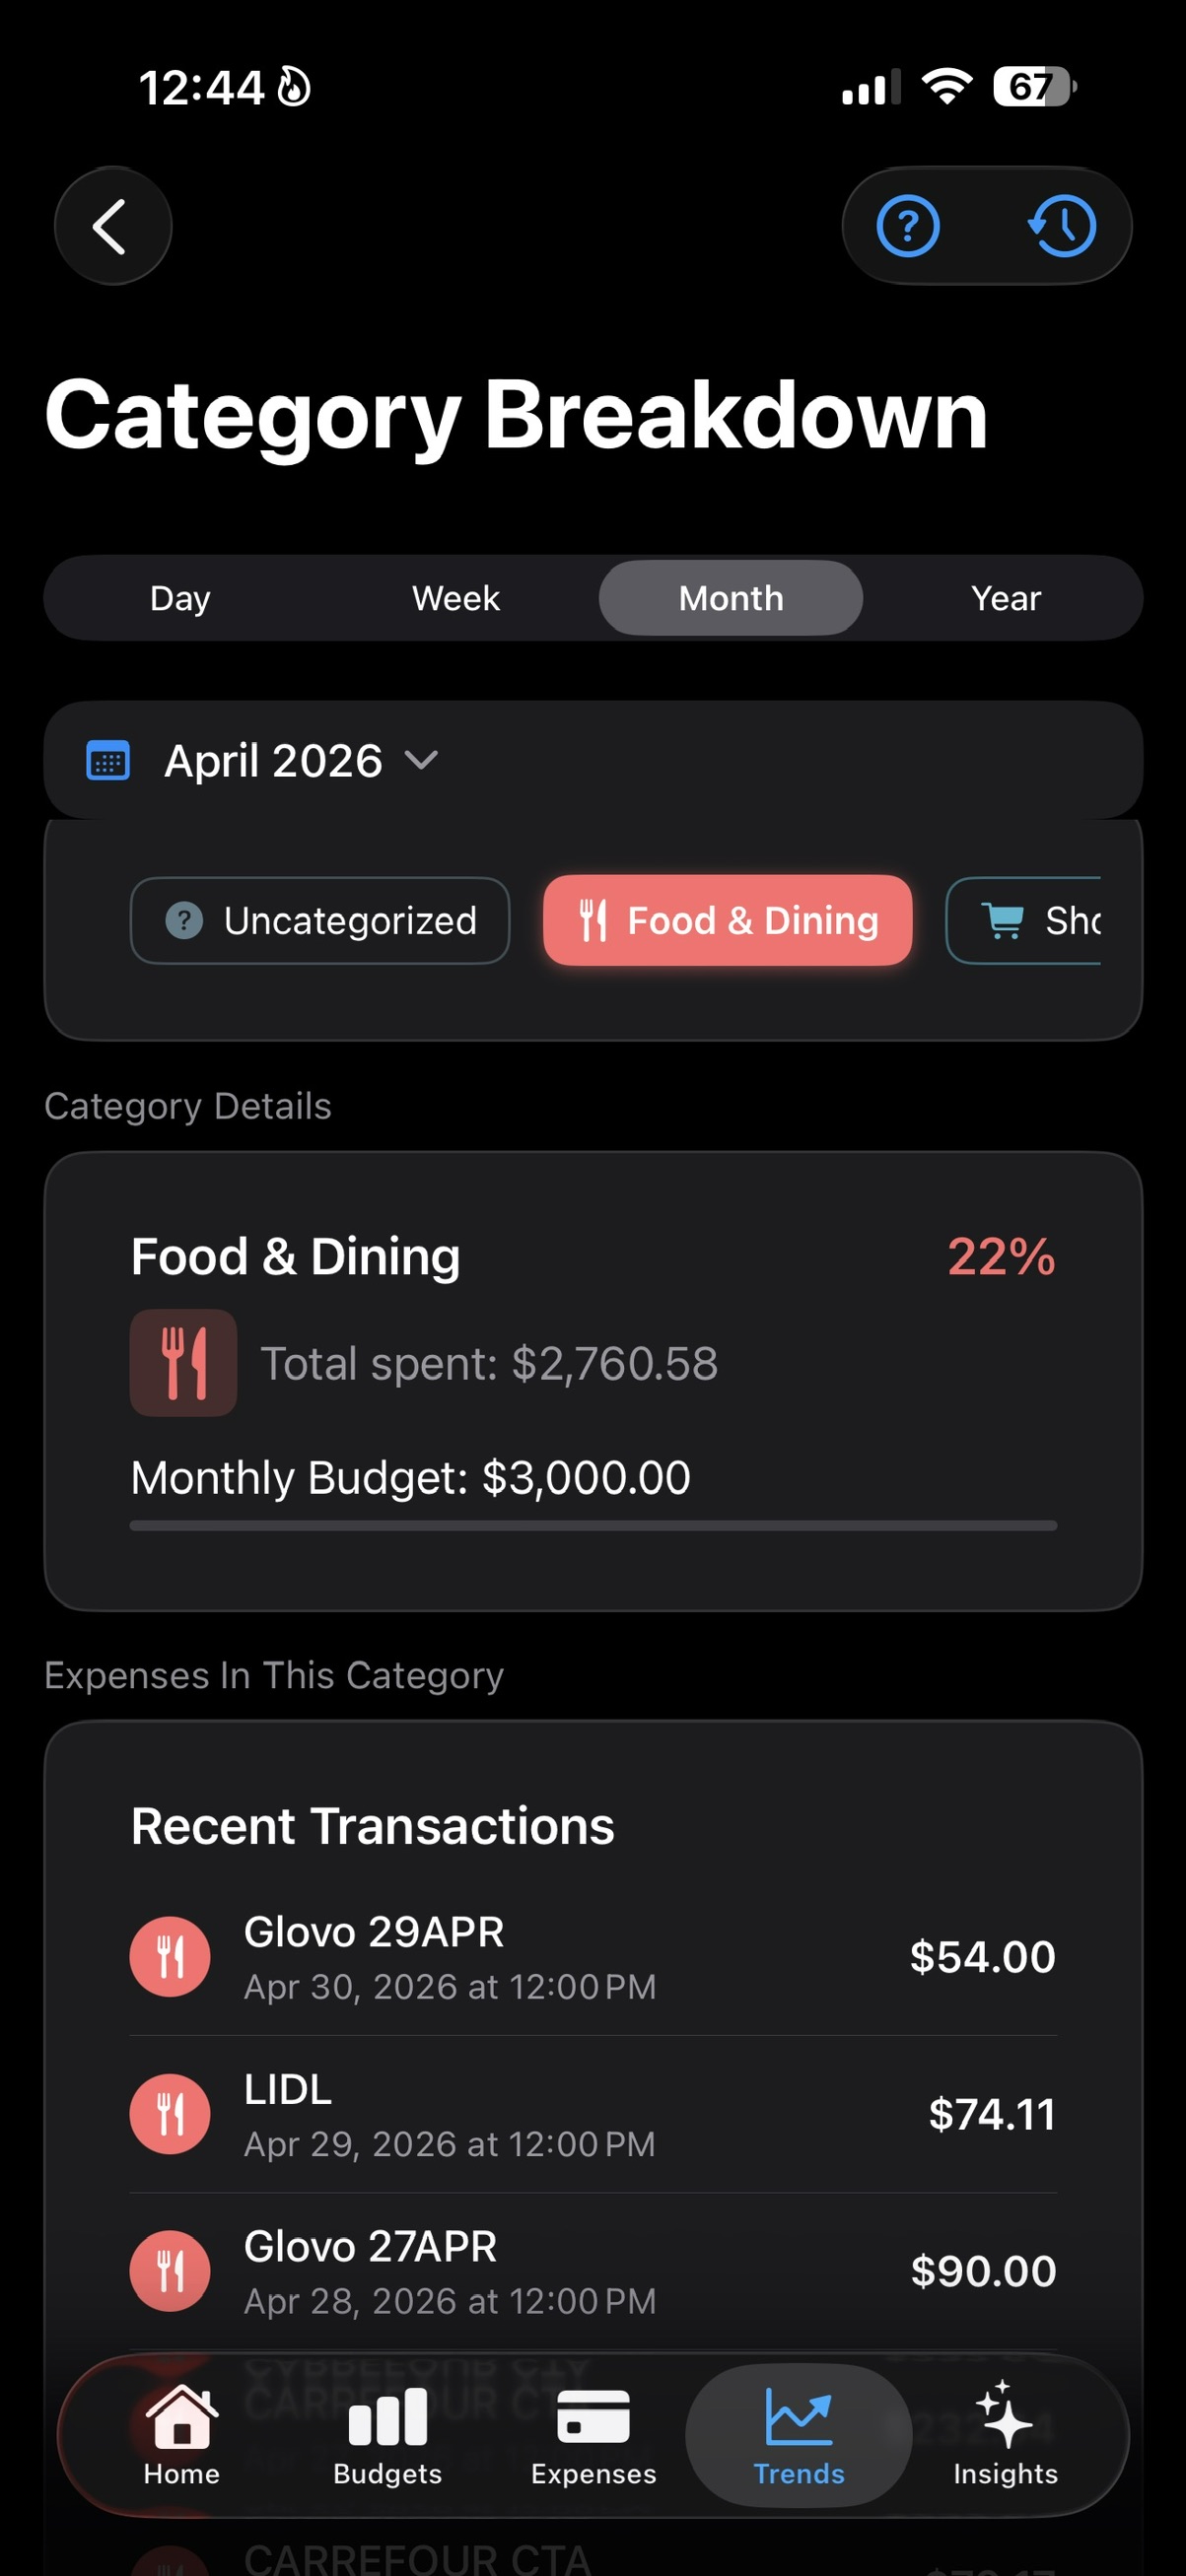
Under the pyramid, the category bar lets you choose the category you want to inspect. Once selected, SmartBudget shows the category details, recent transactions in that category, and any Smart Insights related only to that category.
- Spending Overview is about the largest amounts.
- Category Breakdown is about share of the whole period.
- The detail screens explain what sits behind each chart.